

$10,000 Invested 15 Years Ago: Savings Account, Private Pension, or Stock Market?
Historical analysis of $10,000 invested from 2012 through 2025: savings, private pension insurance, MSCI World, S&P 500 and Nasdaq-100, including inflation, real purchasing power and drawdowns. Not investment advice.
What would have happened if $10,000 had been invested at the beginning of 2012 and then left untouched, with no additional contributions? We compare a traditional savings account, a private pension insurance model benchmark, the MSCI World, the S&P 500 and the Nasdaq-100.
The comparison is not only about the highest ending balance. Three dimensions matter: return, risk and purchasing power.
Initial capital: $10,000
Period: 2012 through the end of 2025
No additional contributions
Equity indices use Total Return or Gross Return data with reinvested distributions where applicable
Inflation adjustment uses the U.S. Consumer Price Index (CPI-U)
Starting Point: $10,000
All strategies start with the same amount:
For an equity index, the historical portfolio value is derived from the ratio of Total Return index levels:
This avoids assuming a constant average annual return. The capital path follows the historical annual returns used in the analysis.
What Did $10,000 Become?
Using the historical annual return series behind the charts, the approximate nominal values at the end of 2025 are:
Return-series sources: MSCI World – MSCI Factsheet · S&P 500 – historical Total Returns · Nasdaq-100 Total Return (XNDX)
Savings account: $10,212
Private pension insurance*: $14,053
MSCI World: $51,787
S&P 500: $70,507
Nasdaq-100: $128,212
* The pension figure is a model benchmark derived from historical contribution yields. It is not the observed performance of a specific policy, and a one-time $10,000 investment is only imperfectly comparable with a traditional policy funded by recurring premiums.
Chart 1 – What $10,000 Became
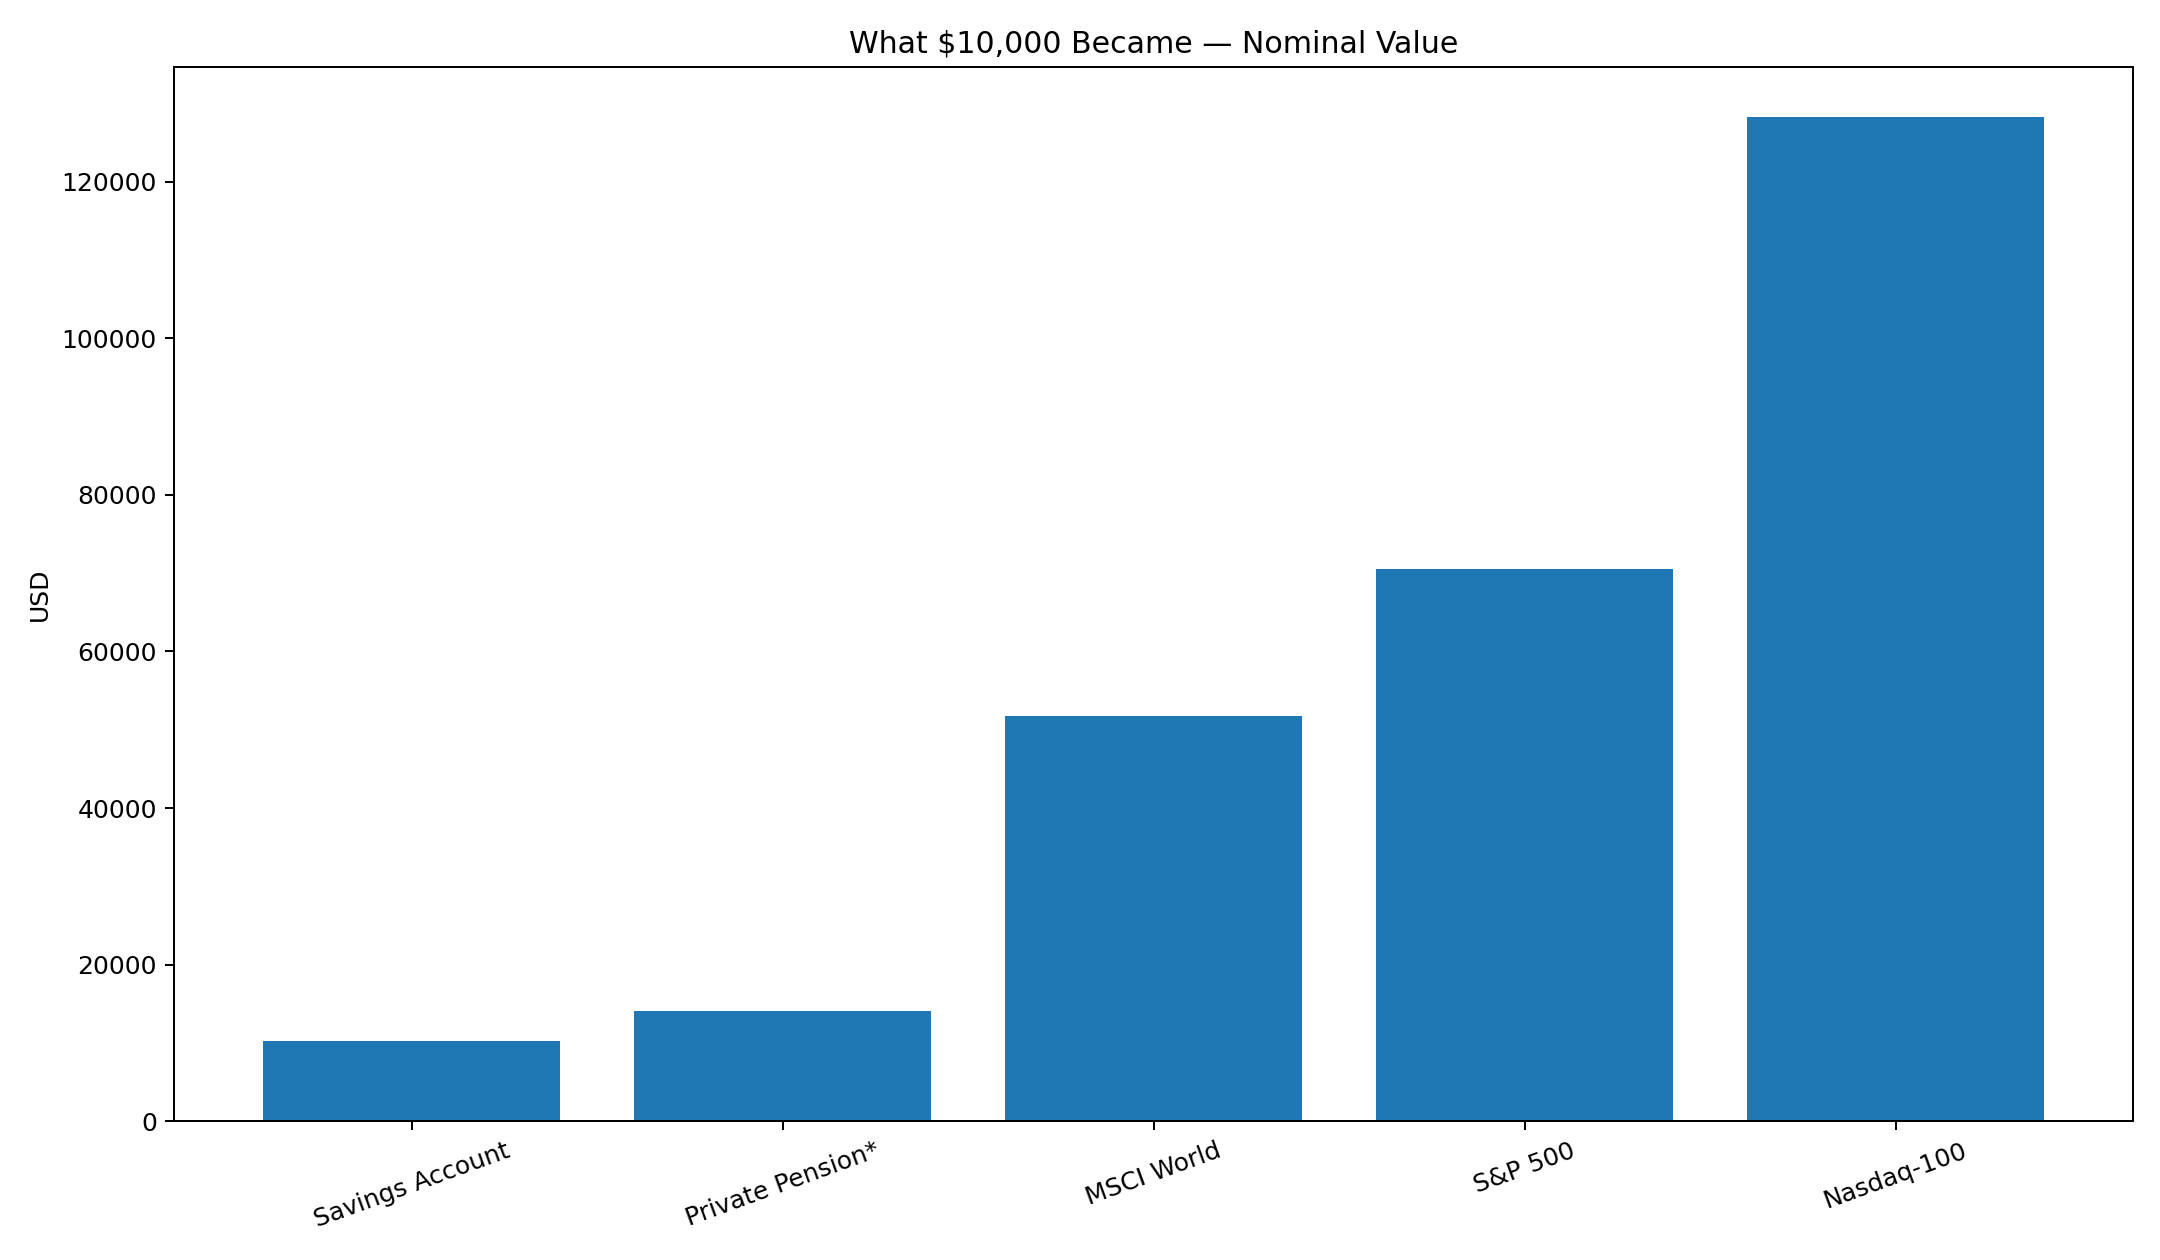
Fig. 1: Nominal value at the end of 2025 of $10,000 invested at the beginning of 2012. Equity values are based on historical Total Return/Gross Return series; the private pension is a model benchmark.
Why Small Differences in Returns Matter
The basic compounding relationship is:
The annualized return is expressed as CAGR:
For the period analyzed, the approximate CAGR values are 0.15% for savings, 2.46% for the modeled private pension, 12.46% for MSCI World, 14.97% for the S&P 500 and 19.99% for the Nasdaq-100.
But $10,000 Is No Longer $10,000
Nominal ending values ignore inflation. The annual-average CPI-U used here rises from 98.556 in 2012 to 138.289 in 2025, an increase in the general price level of approximately 40.3%.
Inflation source: U.S. Bureau of Labor Statistics – CPI-U
To preserve the purchasing power of $10,000 from 2012, approximately $14,031 would have been required by the end of 2025:
A Nominal Gain Can Still Be a Real Loss
The savings account grows nominally to about $10,212, far below the roughly $14,031 required merely to preserve the original purchasing power.
Savings-rate sources: FDIC/FRED – historical Savings Rate · FDIC/FRED – current Savings Rate
The inflation-adjusted value is calculated as:
For the savings account this produces an ending value of approximately $7,278 in 2012 dollars, corresponding to a real purchasing-power loss of roughly 27%.
Chart 2 – Nominal Value vs. Real Purchasing Power
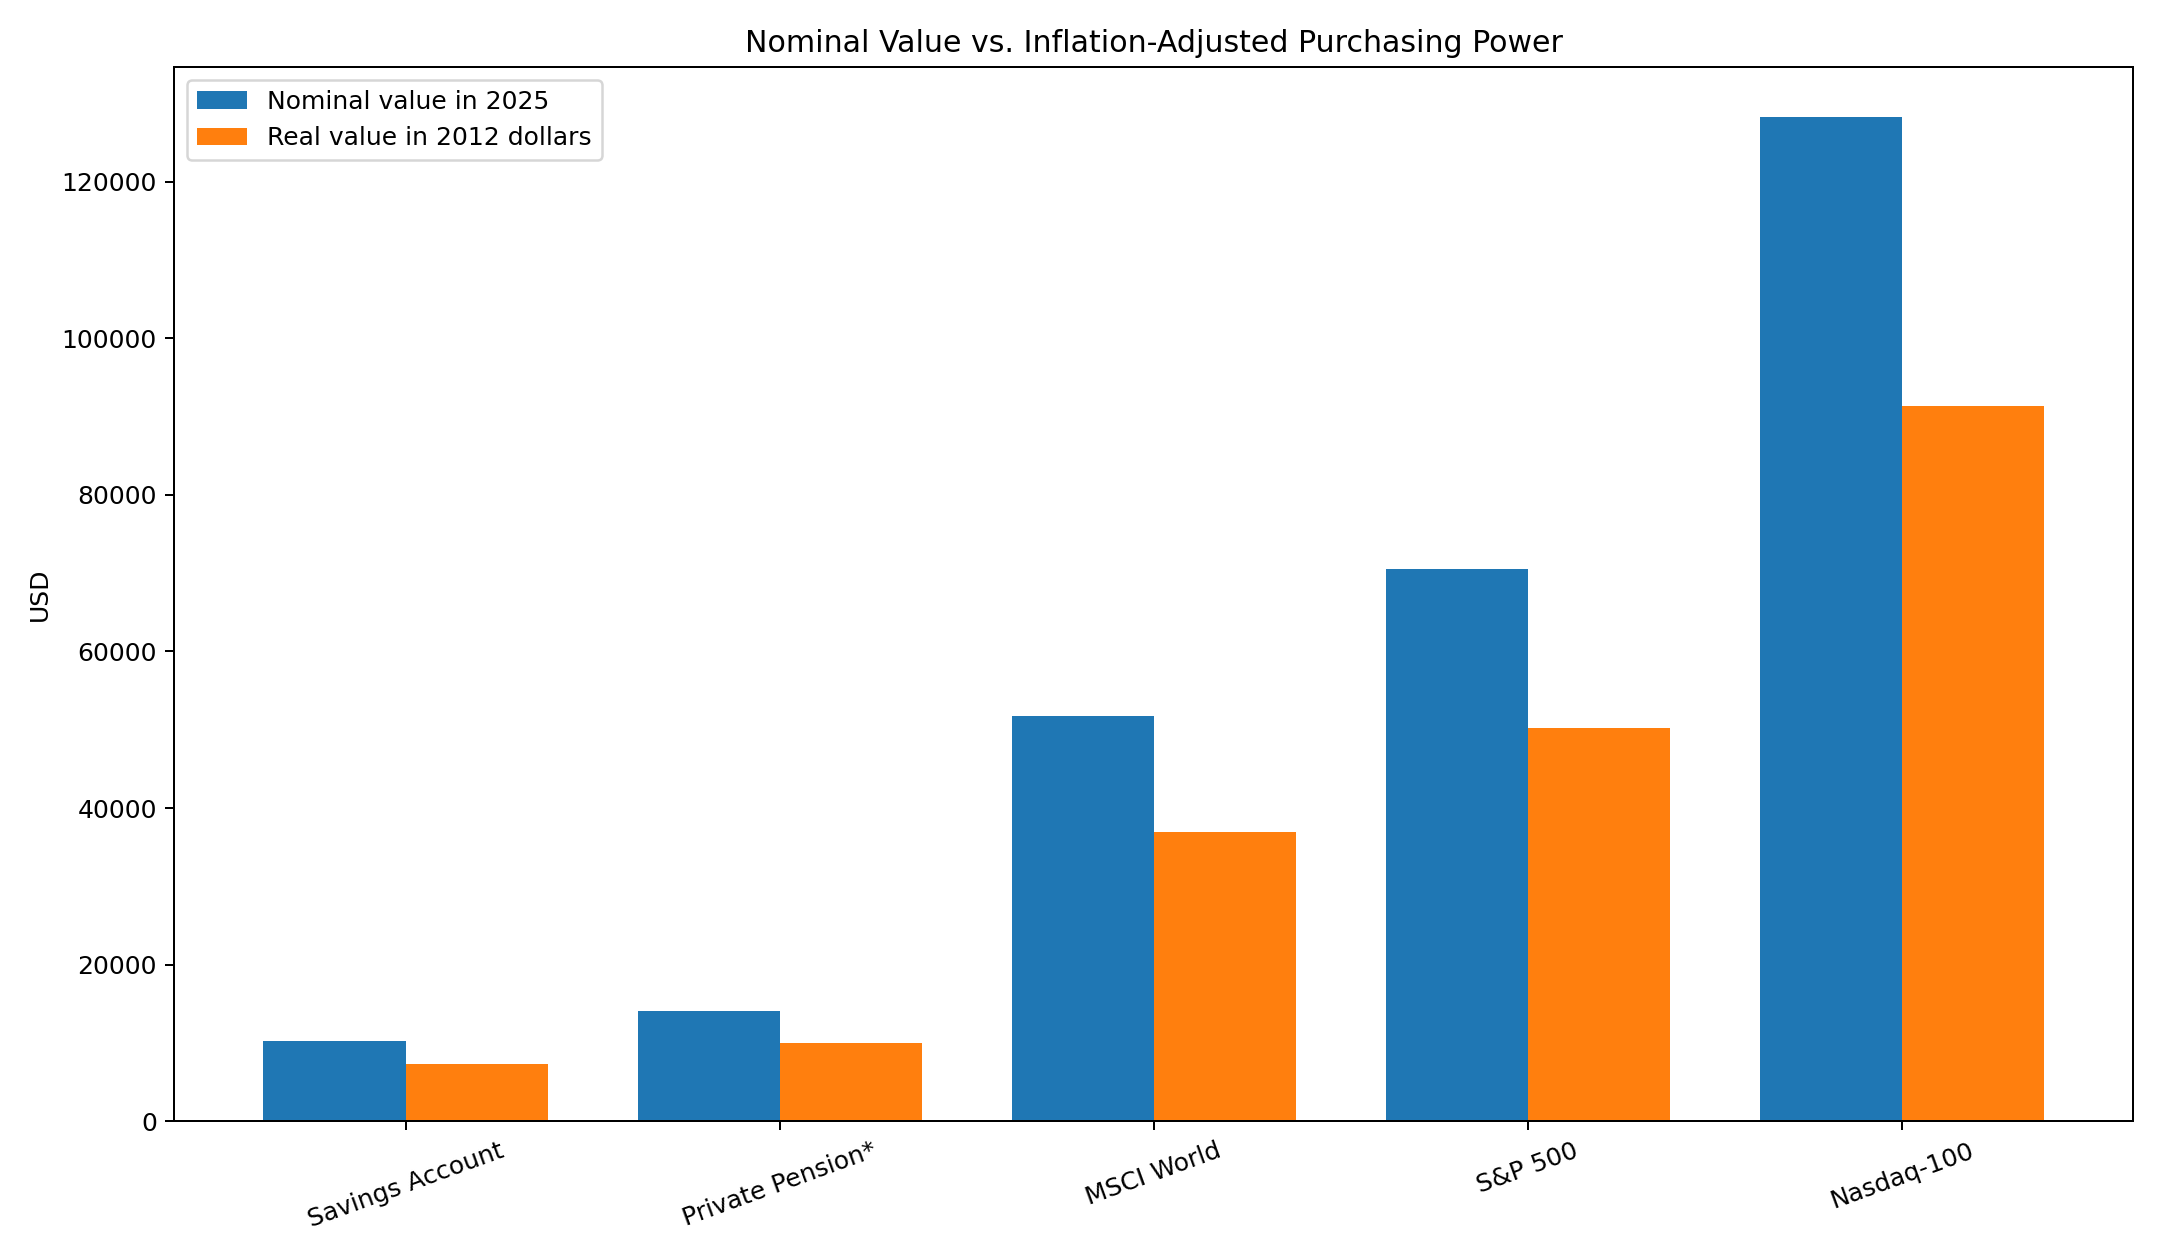
Fig. 2: Nominal ending values in 2025 compared with inflation-adjusted values expressed in 2012 dollars. Inflation reduces the real value of every investment and is especially visible in the low-yield savings account.
Inflation as an Invisible Loss
A savings account shows little market volatility, but a real economic loss can still occur whenever the nominal interest rate is below inflation:
Approximately:
More precisely:
Chart 3 – Savings Account vs. Purchasing-Power Preservation
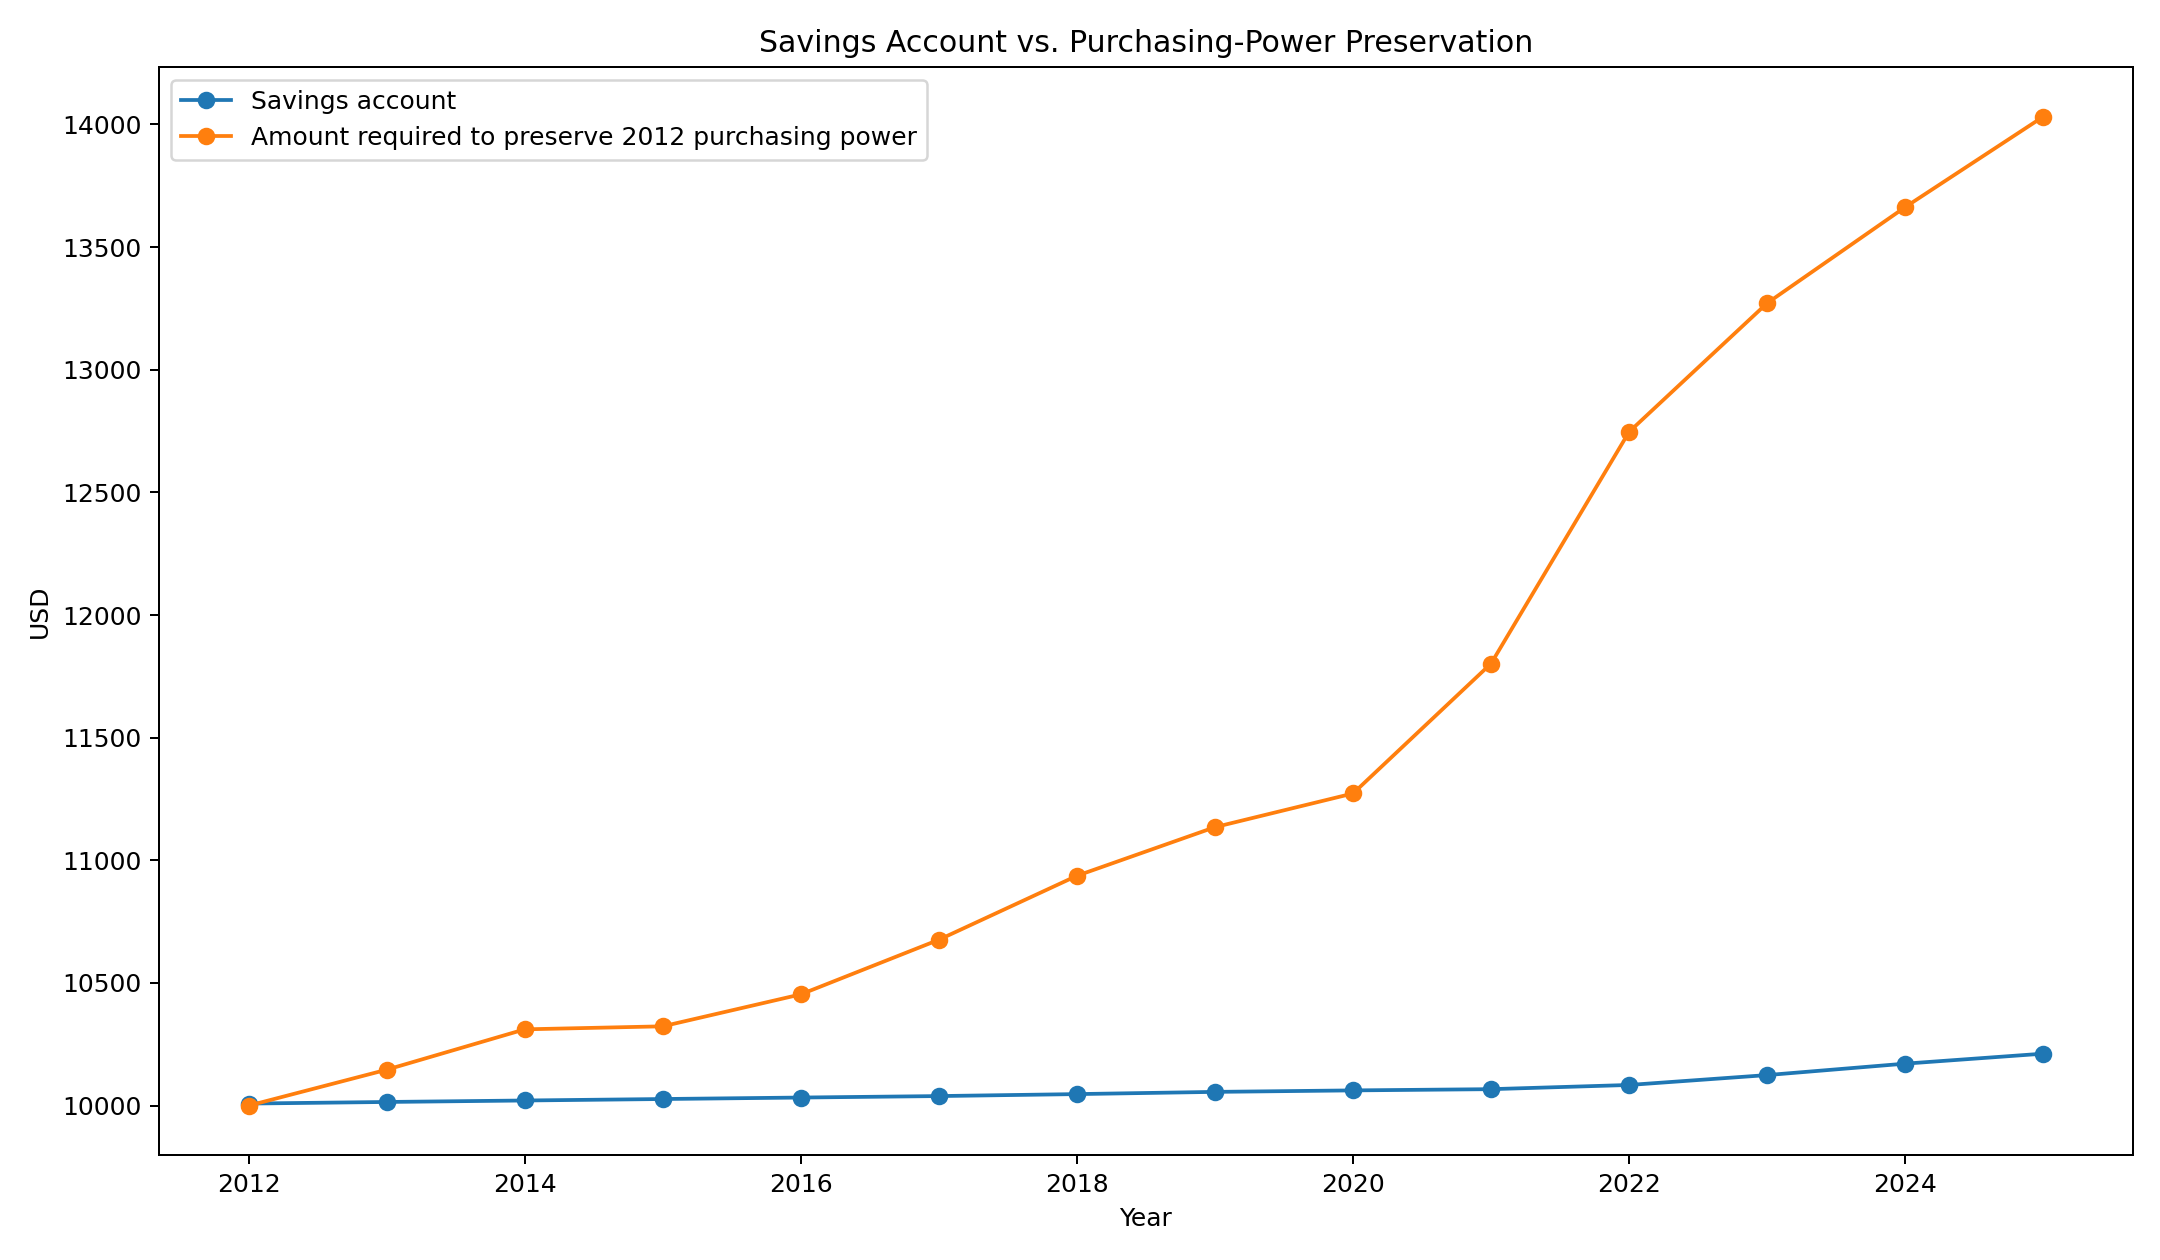
Fig. 3: Historical development of the savings benchmark compared with the amount required to preserve the purchasing power of $10,000 from 2012. The widening gap represents the real loss of purchasing power.
The Private Pension Insurance Policy
A traditional private pension insurance policy is not directly comparable with an equity index. Acquisition costs, ongoing expenses, guarantees, profit participation, contract duration and surrender values all affect the actual customer return.
After acquisition and distribution costs, a simplified starting value can be written as:
With ongoing expenses:
Assekurata reported a 2025 running interest-crediting rate of 2.53%, projected total interest of 3.22% and an illustrated contribution yield of 2.32% for traditional policies. Its research on single-premium contracts found substantially lower yields; for a twelve-year deferral period the average projected contribution yield was 1.07%. Our pension line should therefore be read as a model benchmark rather than an exact single-premium policy.
Pension-insurance sources: Assekurata 2025 market study · Assekurata single-premium study
Returns Are Not Free
The equity indices produced much higher ending values, but investors had to tolerate substantial temporary losses. In 2022 the Nasdaq-100 Total Return lost 32.38% over the calendar year.
Source: Nasdaq – NASDAQ-100 Total Return Index (XNDX)
Chart 4 – The Journey of $10,000
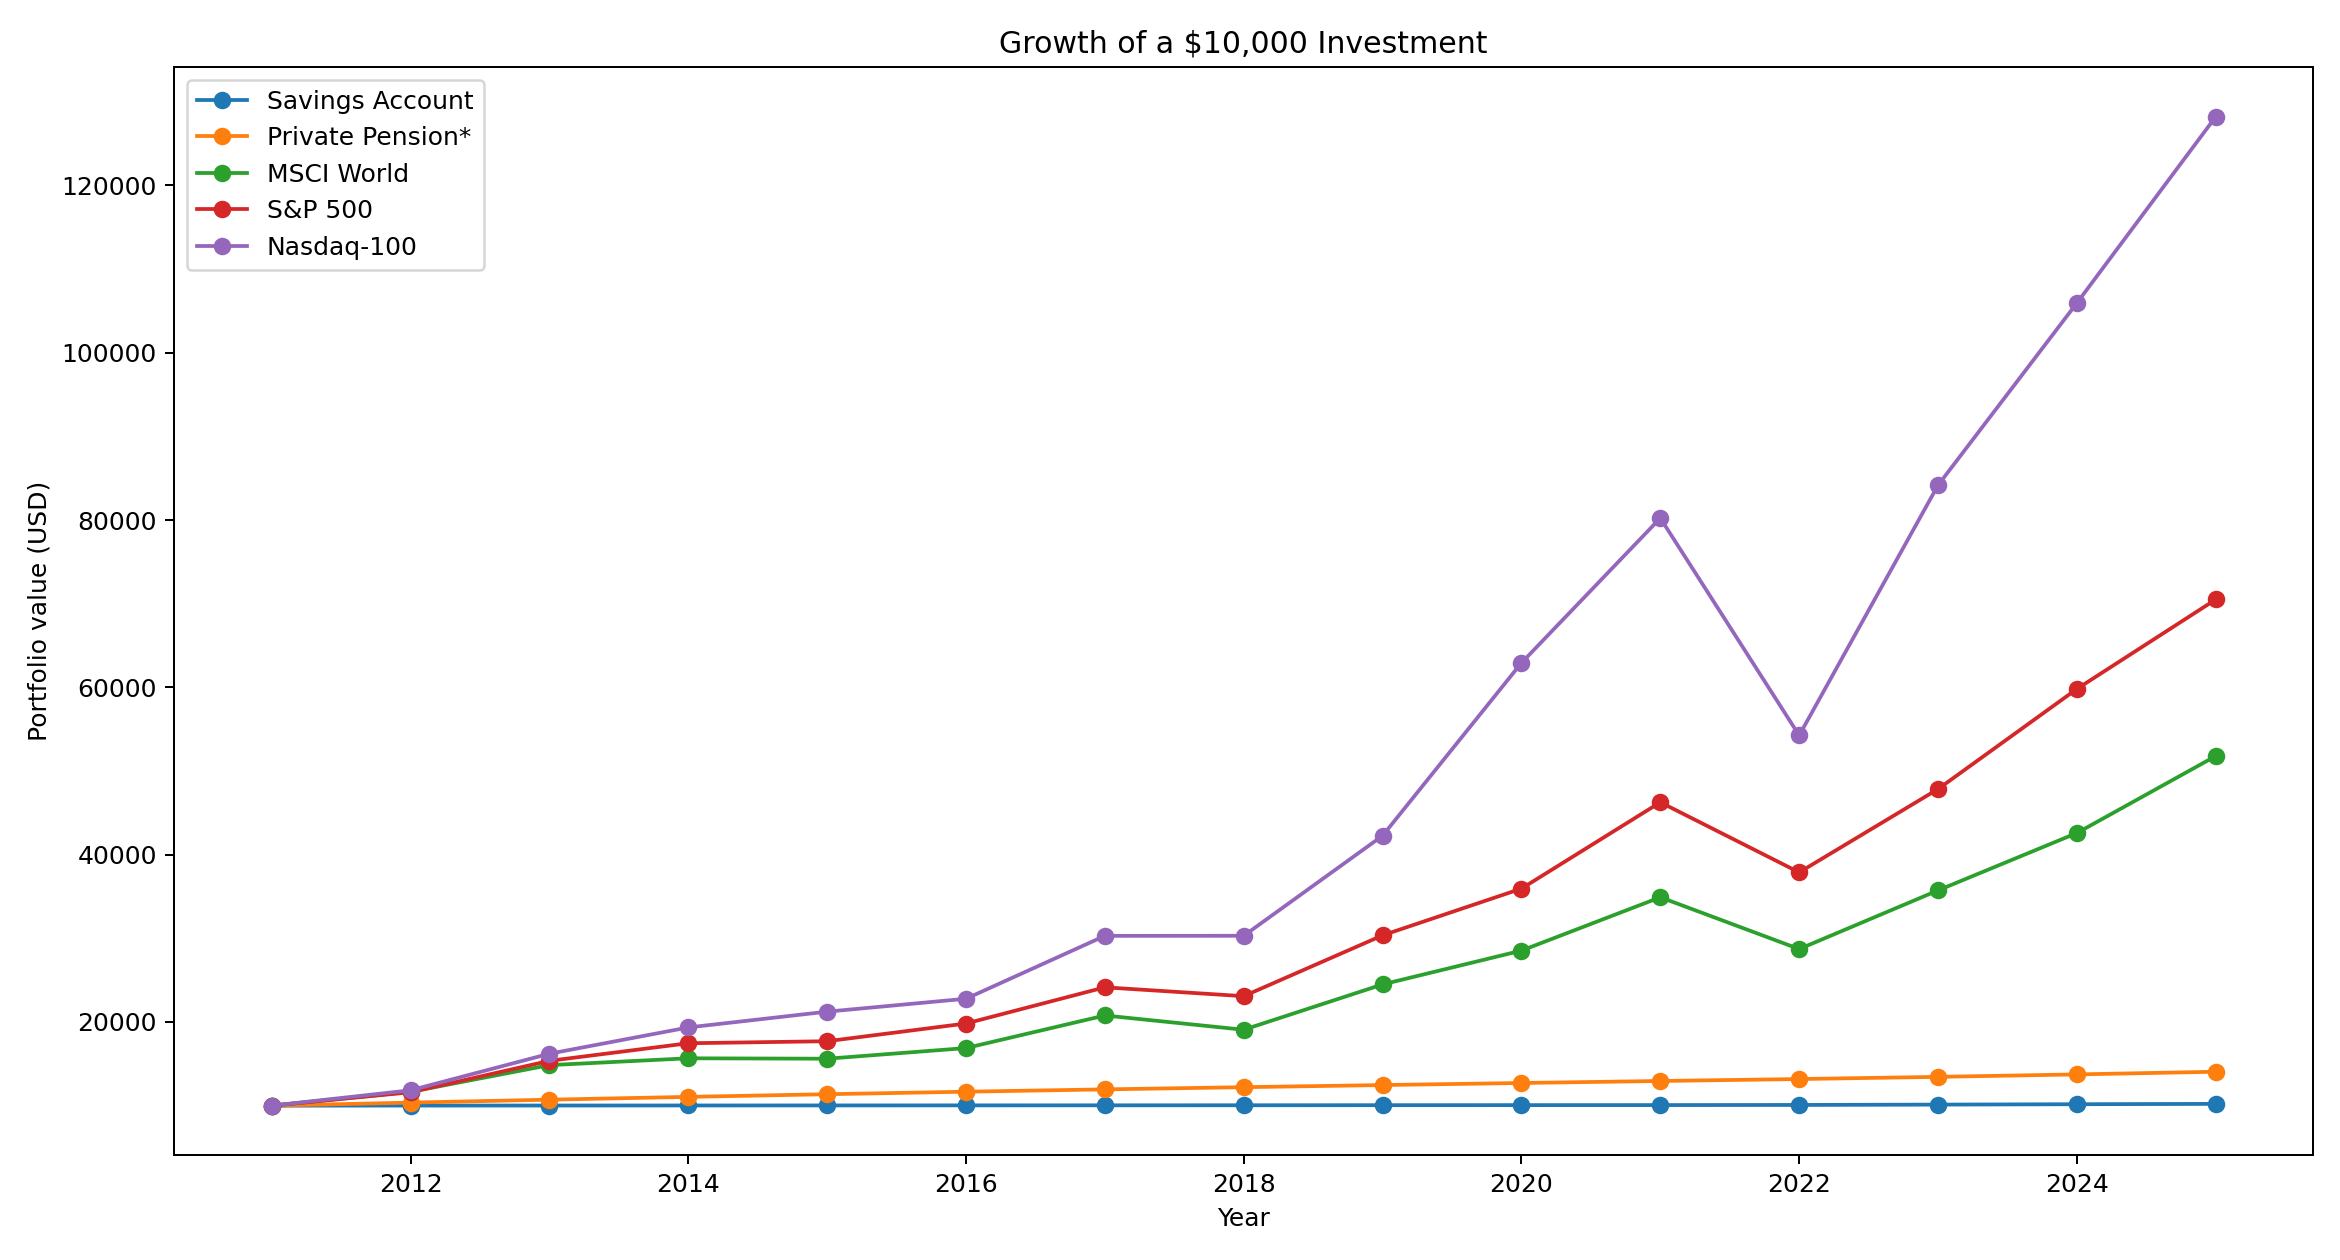
Fig. 4: Historical development of a $10,000 starting investment using the annual return series from 2012 through 2025. The chart highlights compounding and the large divergence between the investment approaches.
How Do We Measure a Drawdown?
First, we determine the highest portfolio value reached up to each point in time:
Drawdown is the percentage distance from that previous high:
The largest observed decline is the maximum drawdown:
Chart 5 – Drawdown from Previous High
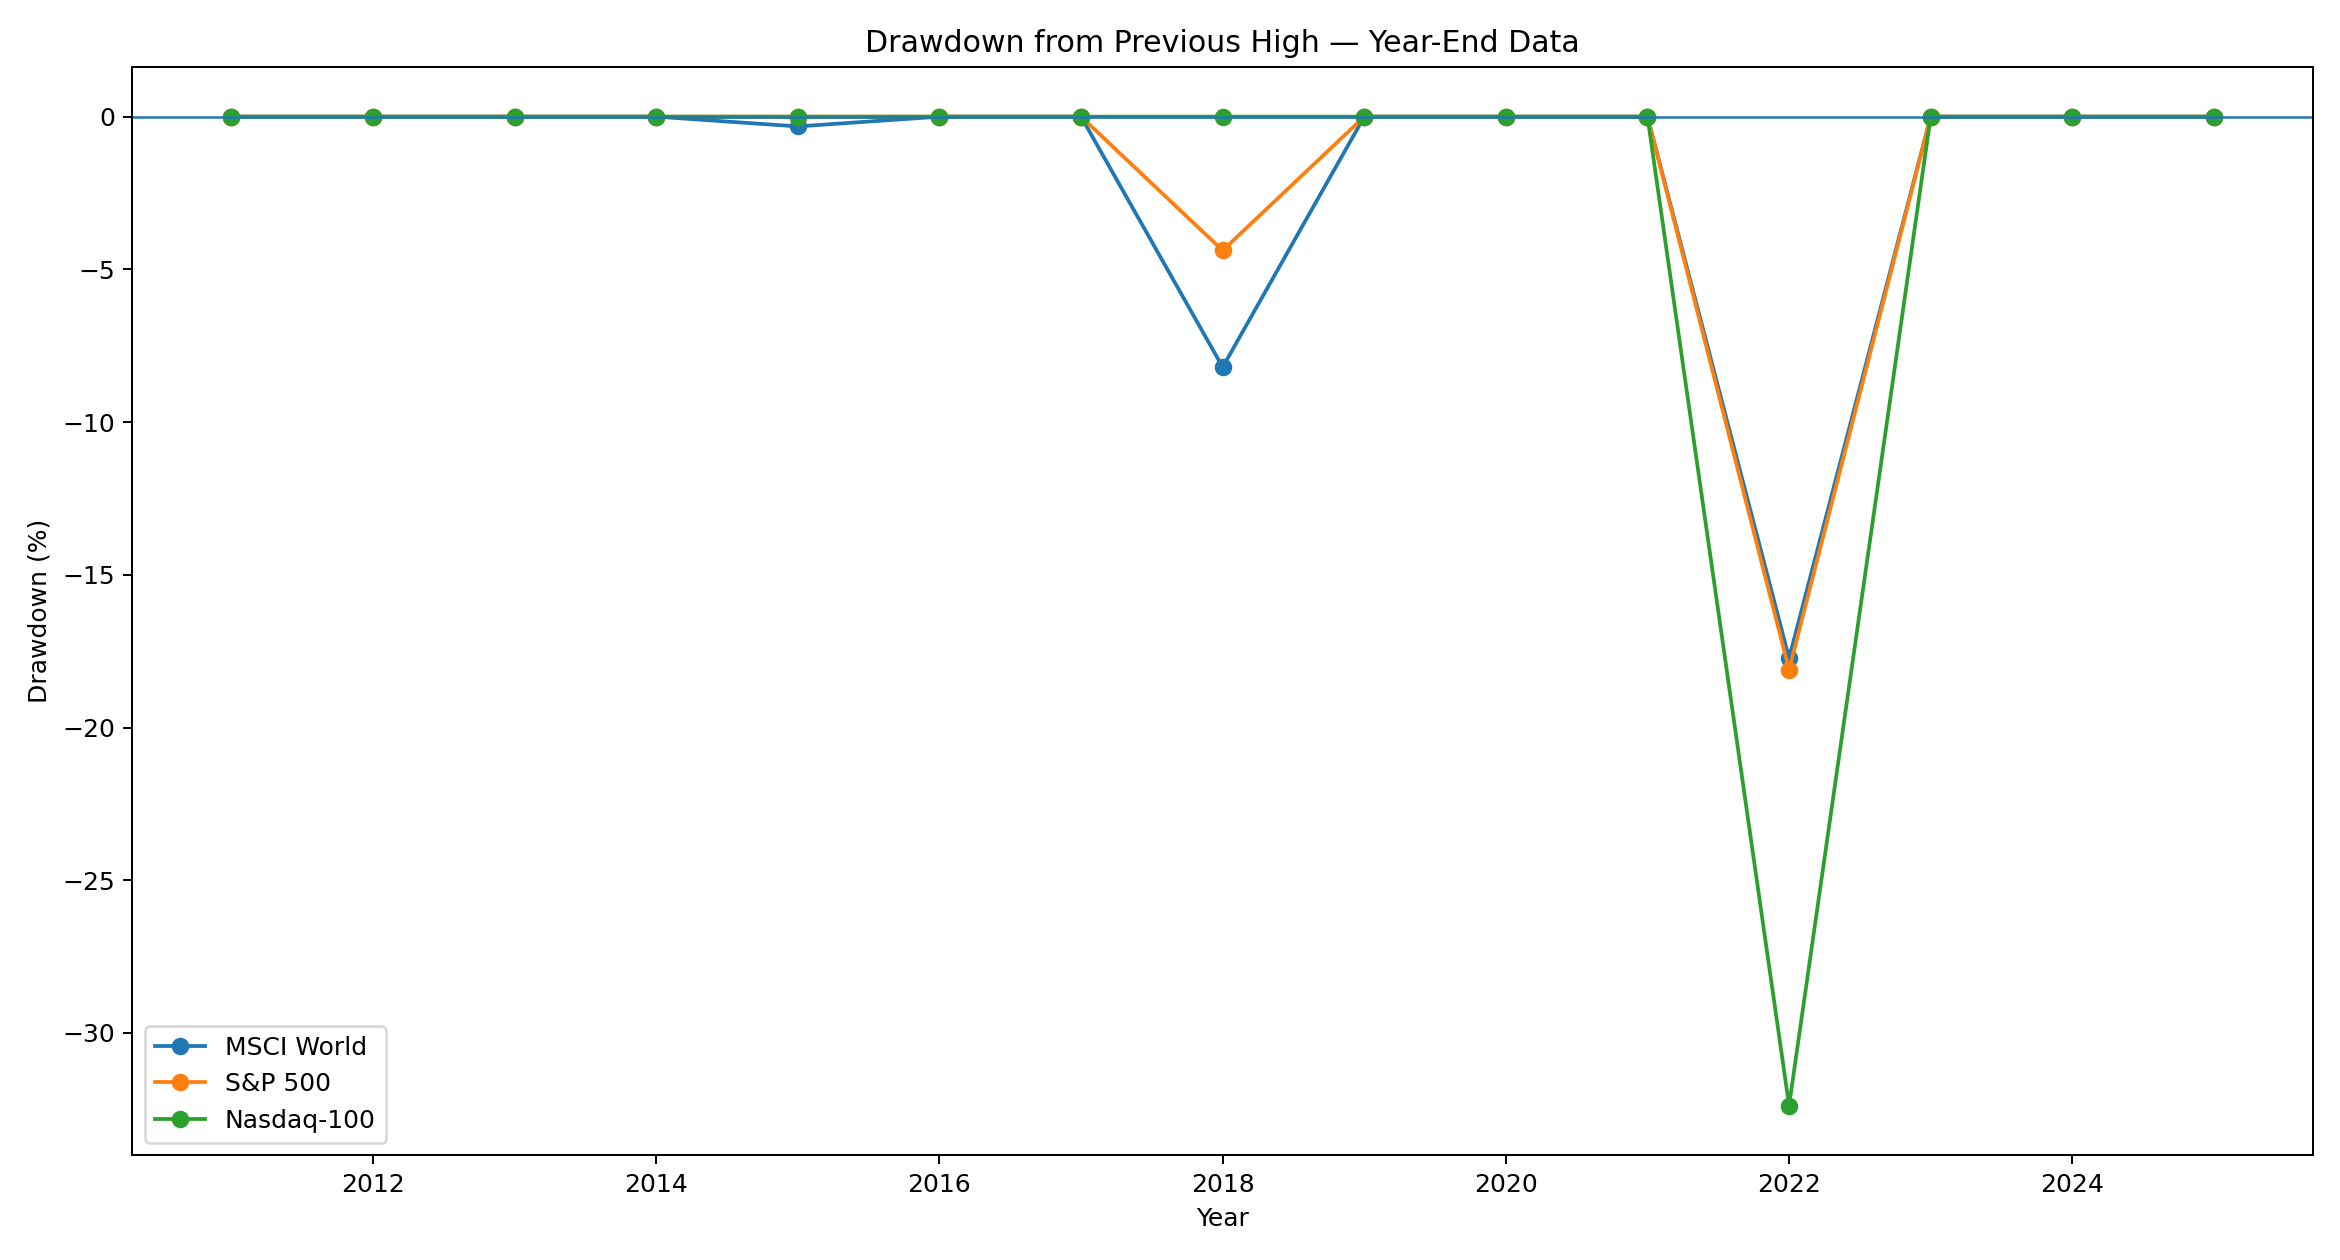
Fig. 5: Drawdowns for MSCI World, S&P 500 and Nasdaq-100 based on year-end observations. Important: short intrayear crashes—especially March 2020—are understated. Monthly or daily observations are preferable for a final risk study.
Return and Risk Belong Together
The ending value alone does not show how much temporary loss an investor had to tolerate. Annualized return and drawdown therefore need to be considered together.
Chart 6 – Return vs. Historical Drawdown
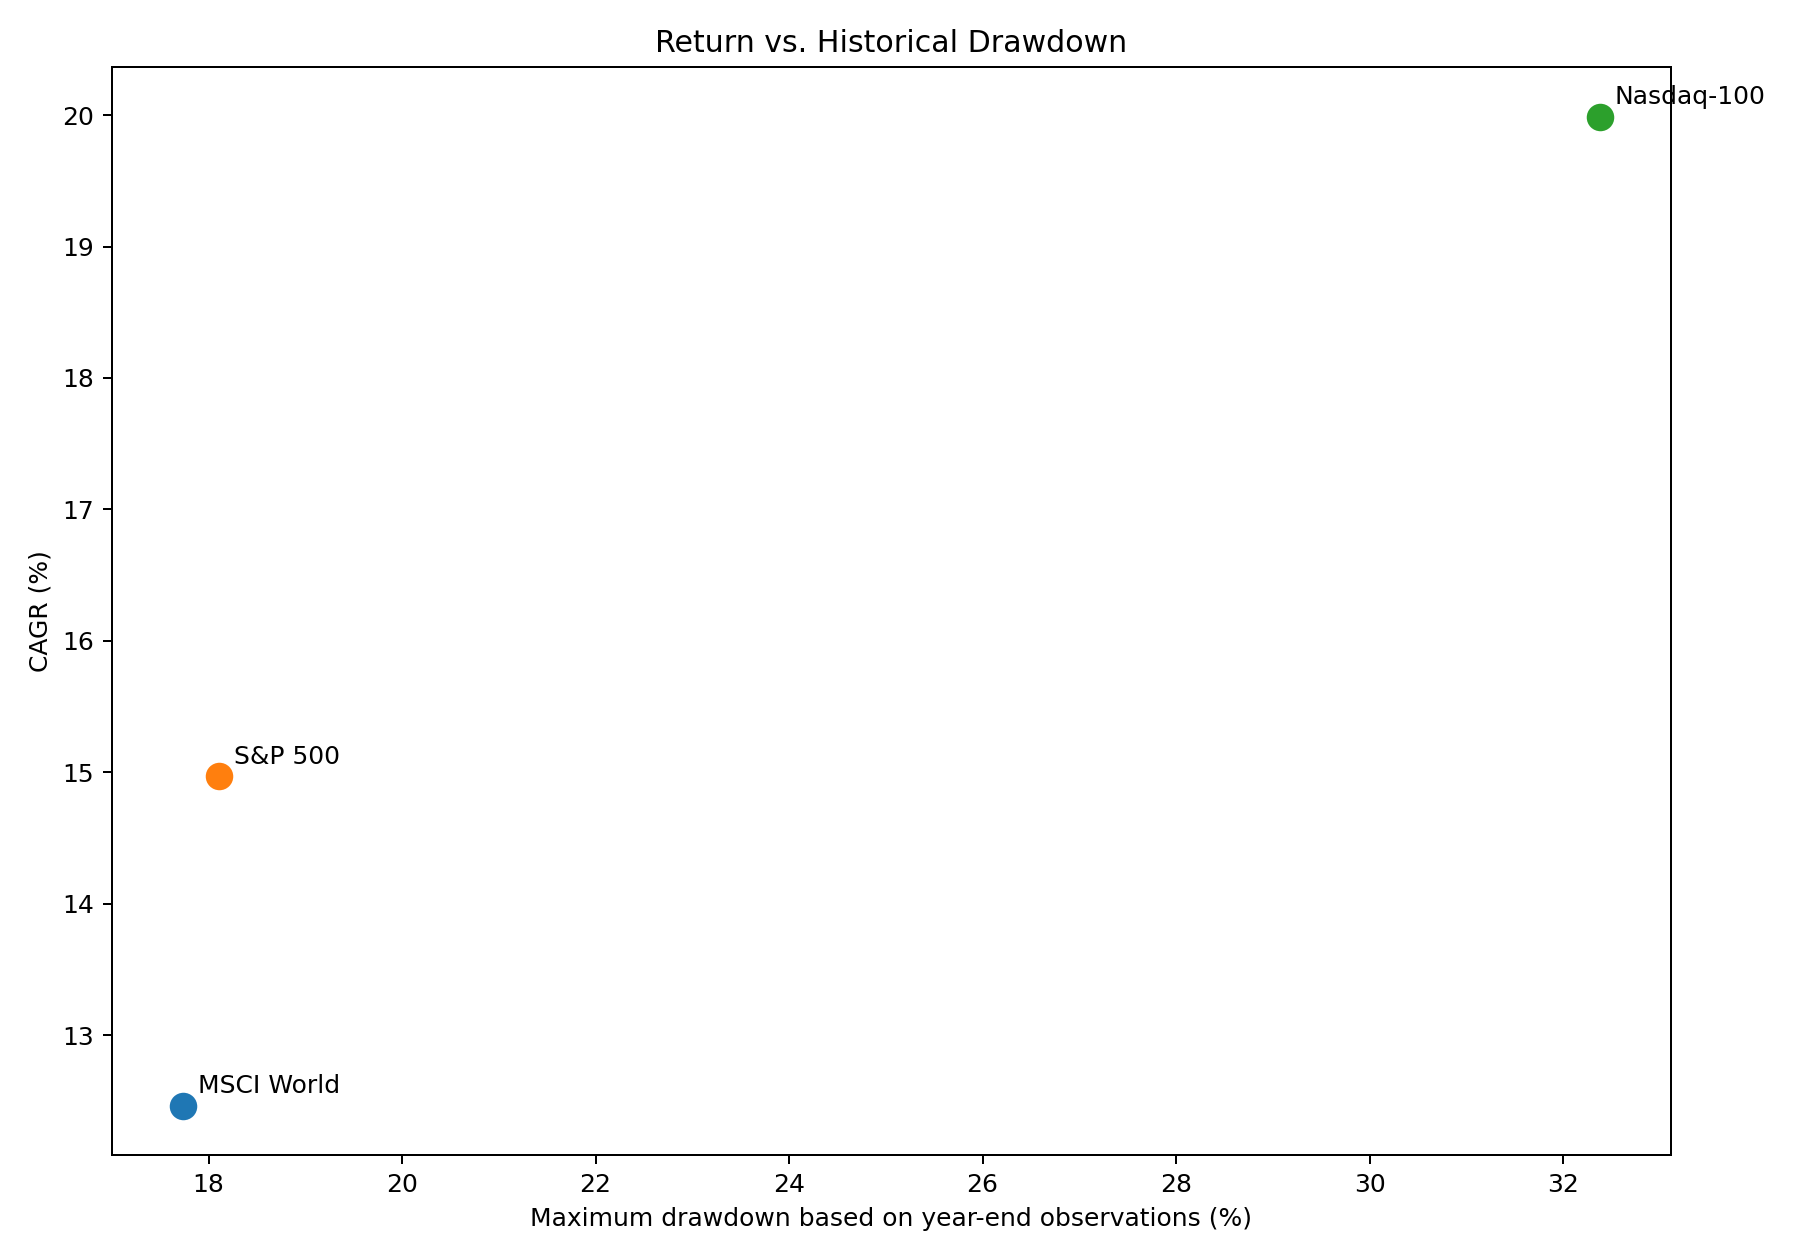
Fig. 6: CAGR compared with maximum drawdown based on year-end observations. The chart illustrates the historical trade-off between higher returns and larger temporary losses.
Conclusion
The comparison reveals three different forms of risk. Savings had little visible market volatility but suffered a substantial loss of purchasing power. Private pension insurance may provide guarantees and insurance features, but costs and lower liquidity reduce the economic return. Equity indices created substantially more real wealth during the period analyzed, but investors had to be willing to tolerate temporary losses of several tens of percent.
The key question is therefore not only: How much money do I have at the end? It is: How much purchasing power do I have at the end—and how much risk did I have to take to get there?
Historical returns do not guarantee future performance. This analysis is provided for educational purposes only and does not constitute investment advice.
Methodology
Period: calendar years 2012 through 2025
Initial capital: $10,000
No additional contributions
MSCI World: Gross Return in USD
S&P 500: Total Return including reinvested dividends
Nasdaq-100: Total Return (XNDX)
Inflation: U.S. CPI-U annual averages
Savings account: historical FDIC National Savings Rates; older and current FDIC series are combined
Private pension insurance: model benchmark derived from published Assekurata contribution yields; not a specific policy
Taxes, individual transaction costs and currency effects are excluded
Disclaimer
This article is provided for informational and educational purposes only and presents historical data and model calculations. It does not constitute investment advice, an investment recommendation, or a solicitation to buy or sell financial instruments. Historical returns and model calculations do not guarantee future results. Investments in securities involve risk and may result in substantial losses, including the loss of invested capital.
Sources and Data References
MSCI – MSCI World Index Factsheet (Gross Returns, USD)
Nasdaq – NASDAQ-100 Total Return Index (XNDX)
S&P 500 annual total returns – historical series
U.S. Bureau of Labor Statistics – CPI-U annual averages
FRED / FDIC – National Rate on Non-Jumbo Deposits: Savings (historical series)
FRED / FDIC – National Rate: Savings (current methodology)
Assekurata – 2025 study on profit participation and guarantees
Assekurata – Single-premium policies and contribution yields