
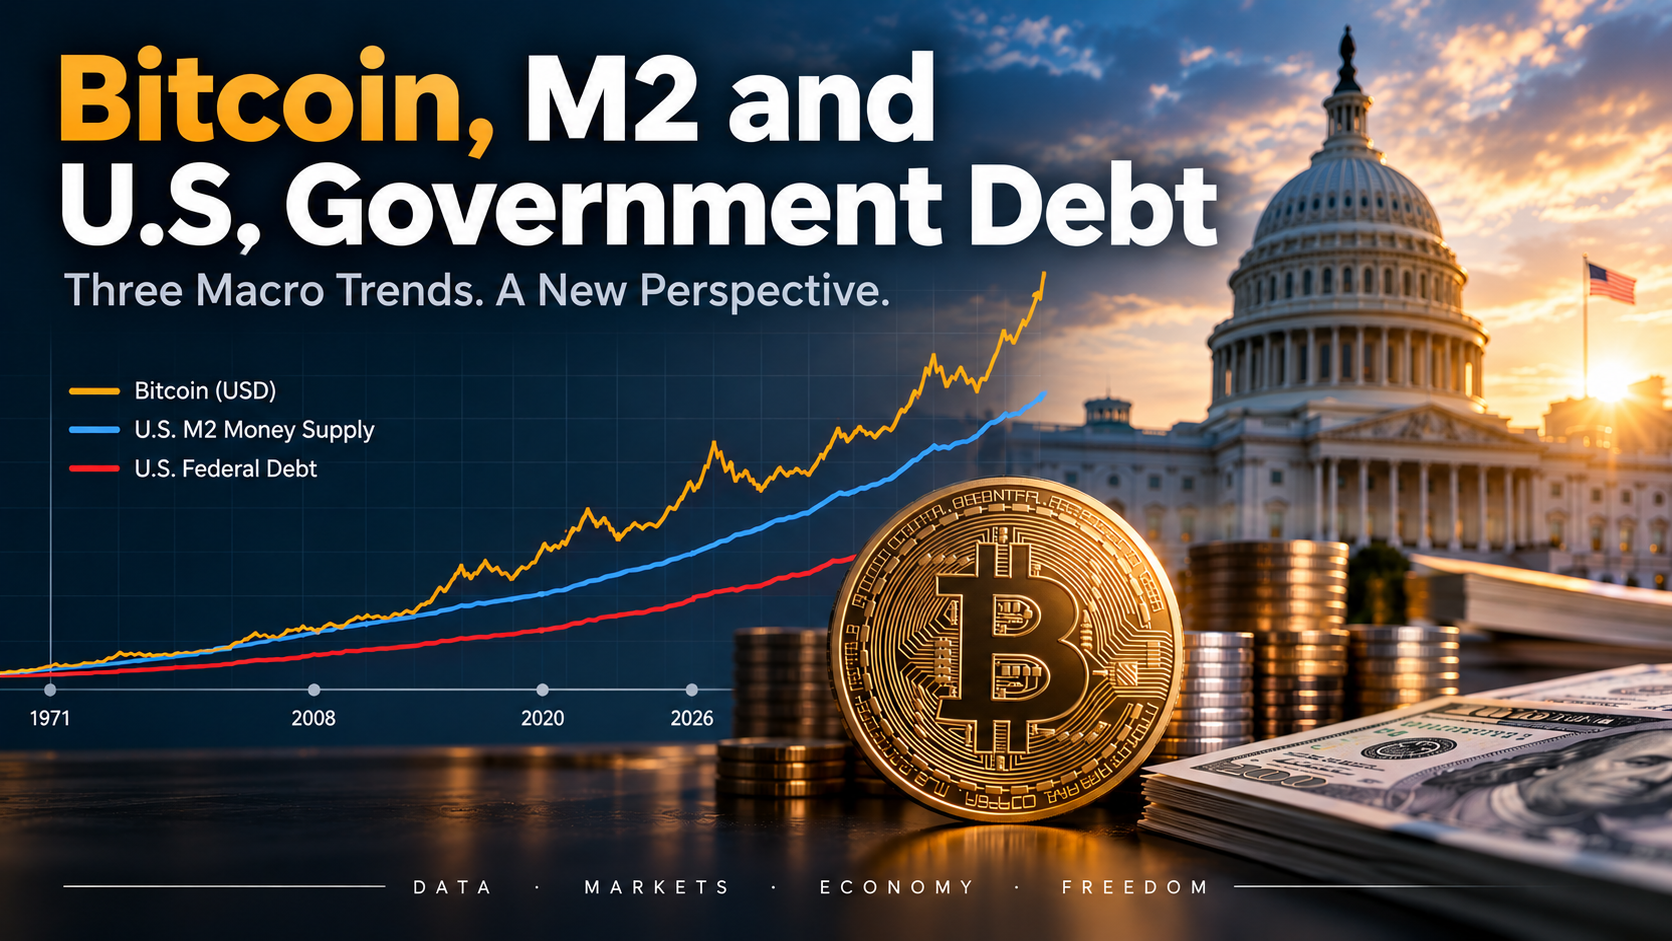
Bitcoin, Money Supply and Government Debt
At the beginning of September 2026, U.S. gross federal debt stood at approximately $40.1 trillion while the money supply has expanded over time. What does M2 mean, how does today's monetary system work, and why is a scarce asset like Bitcoin relevant in this context?
U.S. federal debt has now reached a historic scale: more than 40 trillion U.S. dollars.
$40,000,000,000,000.
At the same time, the money supply has also expanded significantly over the past decades.
This raises an interesting question: What happens over the long run when ever more money and ever higher debt meet assets whose supply is limited?
Bitcoin is especially interesting in this context.
While the supply of U.S. dollars can expand, Bitcoin's maximum supply is fixed at 21 million bitcoin.
This report explains what the M2 money supply means, why it tends to grow over time, and why investors monitor the relationship between global liquidity and Bitcoin.
1971: A Turning Point in the International Monetary System
Until the early 1970s, the international monetary system was still indirectly linked to gold.
Under the Bretton Woods system, many currencies were pegged to the U.S. dollar.
The dollar itself was convertible for foreign central banks at a fixed rate of $35 per troy ounce of gold.
During the 1960s, this system came under increasing pressure.
More and more U.S. dollars circulated outside the United States while U.S. gold reserves did not grow at the same pace.
On August 15, 1971, U.S. President Richard Nixon responded.
The United States closed the so-called Gold Window. Foreign central banks could no longer convert dollars into gold at the fixed official price.
This was a decisive step toward the end of the Bretton Woods system.
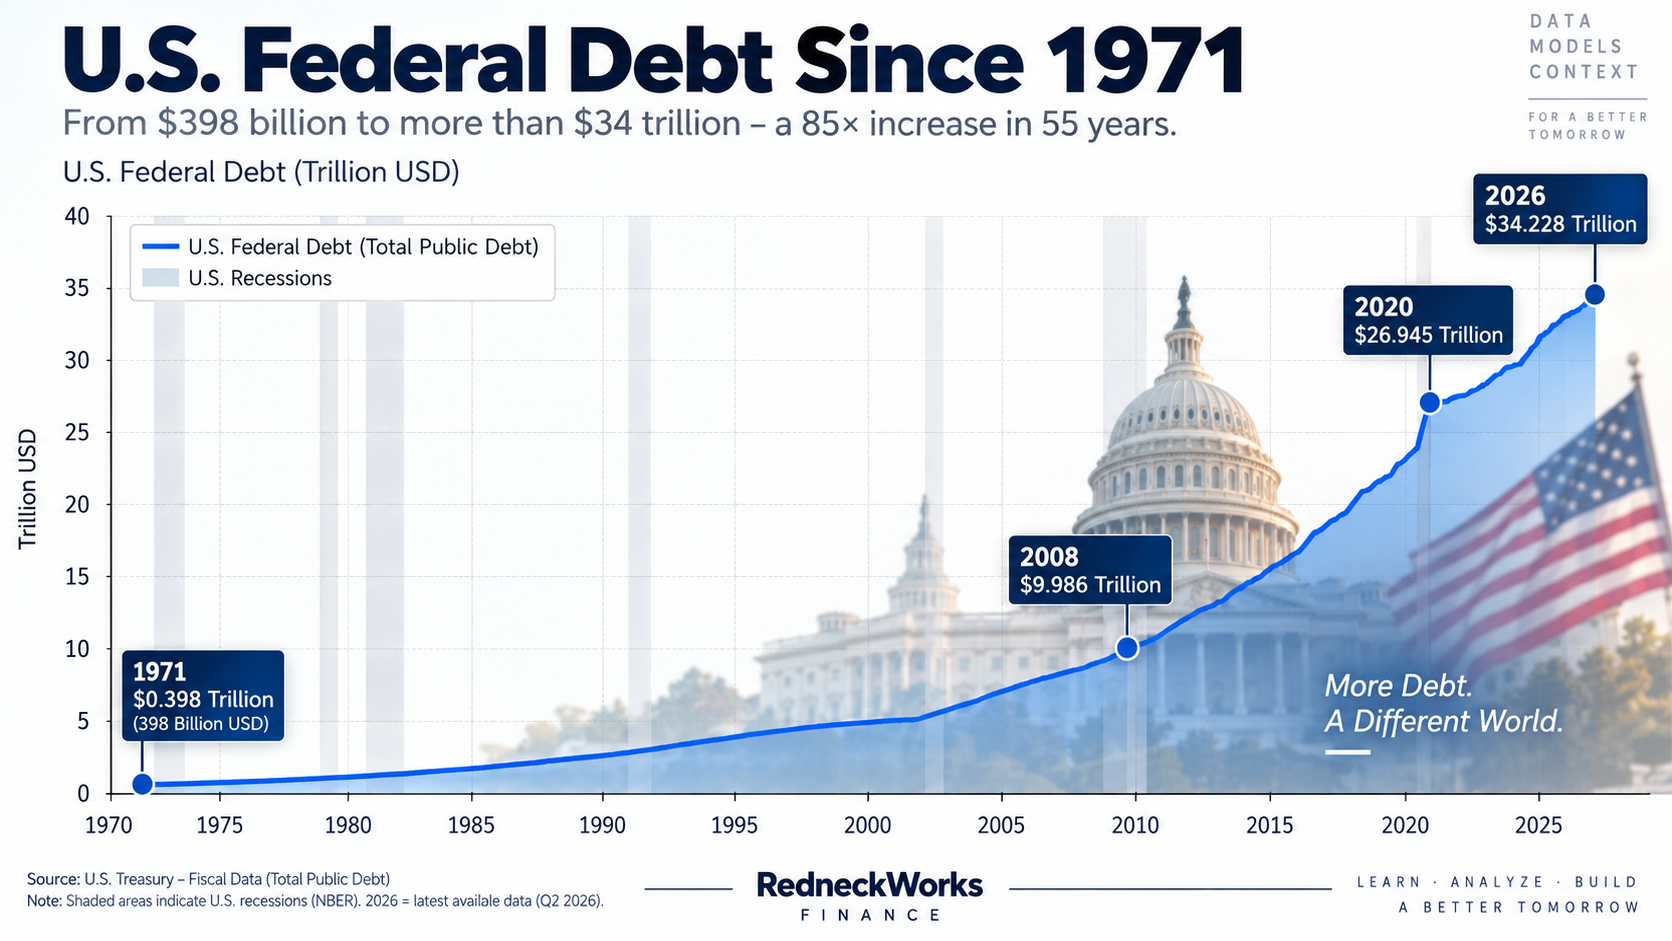
CHART 1 – U.S. Federal Debt Since 1971: U.S. federal debt since 1971 with markers for 1971, 2008, 2020 and 2026.
How Does Money Work Today?
The U.S. dollar, euro, yen and Swiss franc are all fiat currencies today.
Their value is not guaranteed by the ability to exchange each currency unit for a fixed amount of gold.
Instead, modern money rests on factors such as:
trust in the currency
economic output
central-bank policy
public institutions
bank lending
One important feature of this system is that the money supply can expand.
This is where M2 becomes relevant.
What Is M2?
M2 is a monetary aggregate used by central banks to measure a broad pool of money available in the economy.
In simplified terms, M2 includes cash + bank deposits + savings deposits + certain highly liquid short-term instruments.
M2 therefore covers much more than banknotes and coins.
The U.S. Federal Reserve uses M2 as one of its key money-supply measures.
A simplified representation is:
M1 already includes the most liquid forms of money, such as cash and various bank deposits.
M2 represents a broad stock of relatively liquid money within the economy.
The Money Supply Has Grown Strongly Over Time
Over many decades, the U.S. money supply has become much larger.
There are several reasons for this:
economic growth
credit creation
population growth
higher prices
central-bank policy
financial crises
government support programs
The effect was especially visible during the COVID-19 pandemic, when M2 rose unusually quickly over a short period.
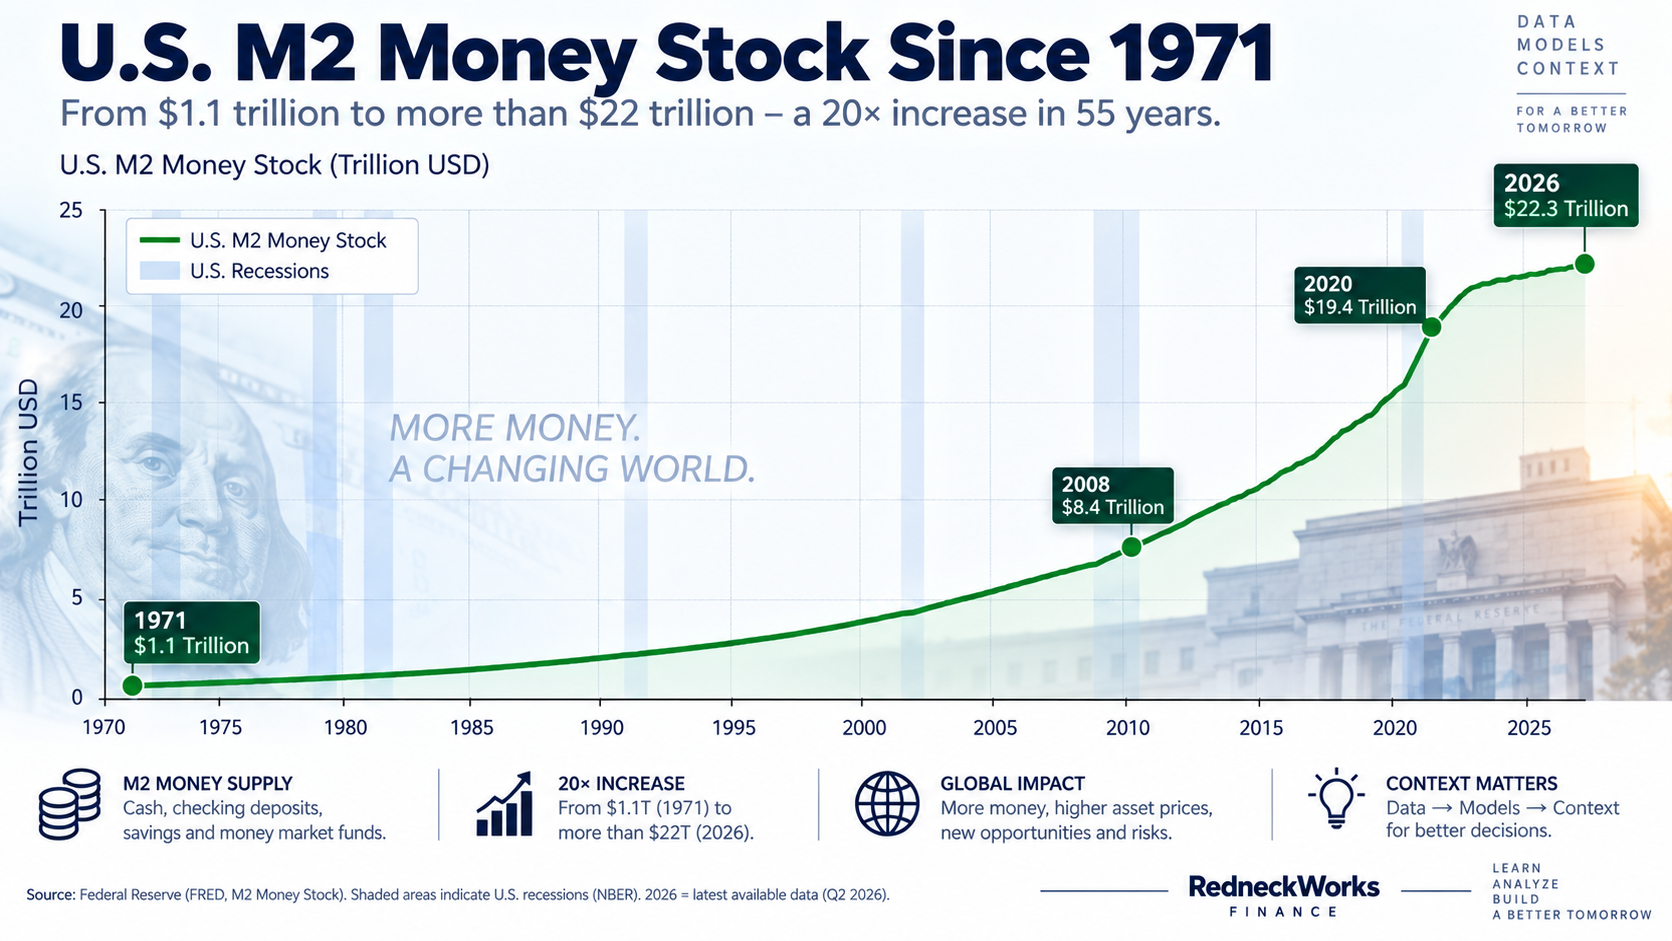
CHART 2 – U.S. M2 Money Stock: M2 since 1971 with emphasis on the long-term trend, the 2008 financial crisis and the 2020/2021 surge.
Does More Government Debt Automatically Mean More Money?
No. This distinction is important.
Government debt and the money supply are not the same thing.
When the U.S. government issues new bonds, that does not automatically mean the Federal Reserve creates the same amount of new dollars.
However, government debt, interest rates and monetary policy are linked over the long run.
The larger a government's debt burden becomes, the more important its interest expense can become.
The United States now carries more than approximately $40.1 trillion in gross federal debt at the beginning of September 2026.
When interest rates are high, financing that debt becomes more expensive.
High debt → high interest expense → high financing needs
Why Do Bitcoin Investors Care?
Bitcoin works fundamentally differently from a government-issued currency.
Its maximum supply is limited by the protocol.
New bitcoin are still created through mining, but the block subsidy is cut roughly in half about every four years.
The original block reward was 50 BTC. It then fell to 25, 12.5 and 6.25 BTC. Since the 2024 halving, it has been 3.125 BTC.
A simplified formula for the block reward is:
where n is the number of halvings.
The issuance of new bitcoin therefore becomes progressively smaller, and the total supply approaches a fixed ceiling of roughly 21 million BTC.
Two Fundamentally Different Systems
Fiat Currencies
Supply can grow over time. New deposits can be created through bank lending, and central banks influence liquidity and financing conditions through monetary policy.
Bitcoin
The maximum supply is limited. New issuance follows predefined rules. No central bank or government can simply raise the maximum supply.
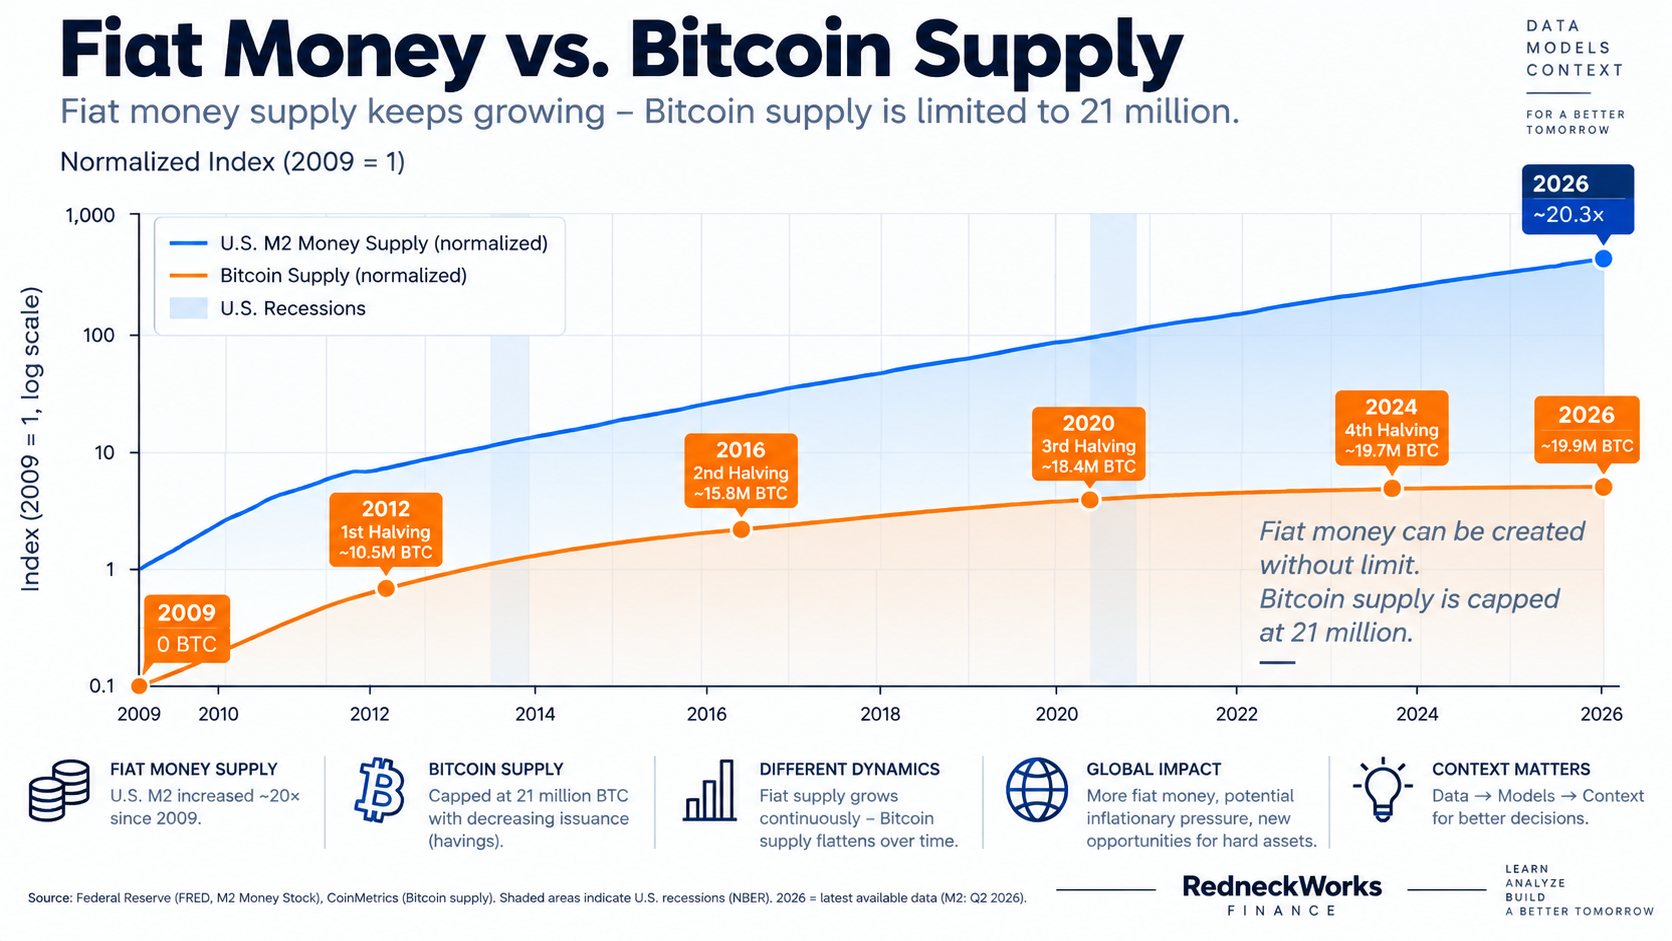
CHART 3 – Fiat Money vs. Bitcoin Supply: A rising fiat-money-supply curve compared with Bitcoin's flattening supply curve and its 21-million maximum.
What Happens When More Money Meets Limited Supply?
The basic principle can be illustrated with a deliberately simple example.
If available capital rises to $200 while only ten assets still exist:
This example is intentionally simplified. It is not a Bitcoin pricing model.
When more capital competes for a limited supply, the price of that asset can rise.
In the real world, additional money is not distributed evenly across all assets.
Capital may flow into stocks, bonds, real estate, gold, commodities or Bitcoin.
Why Not Look Only at U.S. M2?
Bitcoin is a global asset traded around the world.
For that reason, looking only at the U.S. money supply may not be enough over the long run.
Global money supply can also be relevant. A broader framework may include major monetary regions such as:
United States
Euro area
China
Japan
United Kingdom
Global M2 is not a single official worldwide monetary aggregate. In analyses like this, the term usually refers to a composite approximation built from the money supplies of several major currency areas and is used as a proxy for global monetary liquidity.
Fidelity Studied Bitcoin and Global M2
Fidelity Digital Assets has examined this relationship directly.
In its study “Getting Off Zero: Evaluating Bitcoin in 2026,” Fidelity compares Bitcoin's price development with changes in global M2 over roughly 15 years.
Fidelity Digital Assets reports an historical R² of 0.87 in its own analysis:
In simplified terms, this means the historical statistical relationship between changes in Global M2 and Bitcoin was very strong over the period examined.
However, one point is essential: correlation does not automatically imply causation.
A rise in M2 does not guarantee a rise in Bitcoin, and a fall in money supply does not automatically mean Bitcoin will fall.
Why Is the Relationship Still Interesting?
The combination of expanding fiat money supply and Bitcoin's limited supply creates a plausible economic hypothesis.
On one side, the supply of fiat money can grow. On the other, Bitcoin's maximum supply remains fixed at roughly 21 million units.
What happens if more and more capital around the world searches for scarce assets?
Bitcoin is now one of those scarce assets.
U.S. Federal Debt Adds to the Debate
At the beginning of September 2026, U.S. gross federal debt stood at approximately $40.1 trillion.
That does not mean the U.S. dollar is about to collapse.
Nevertheless, very high government debt raises important long-term questions:
How high can interest expense become?
How long can deficits of this magnitude continue?
What role will inflation play?
What role will the Federal Reserve play?
How can purchasing power be preserved over decades?
This is precisely where scarce assets become more relevant to investors.
Bitcoin Is Not an Automatic Answer to Rising Debt
Bitcoin does not automatically rise because government debt rises.
Likewise, Bitcoin does not automatically rise because M2 grows.
Many other factors influence Bitcoin:
interest rates
U.S. dollar strength
regulation
institutional demand
ETF inflows and outflows
the business cycle
market psychology
liquidity
political and geopolitical events
M2 is therefore not a Bitcoin pricing formula. It is another macroeconomic indicator.
An Interesting Historical Relationship
Fidelity's research shows that the historical relationship between global money supply and Bitcoin has been notable.
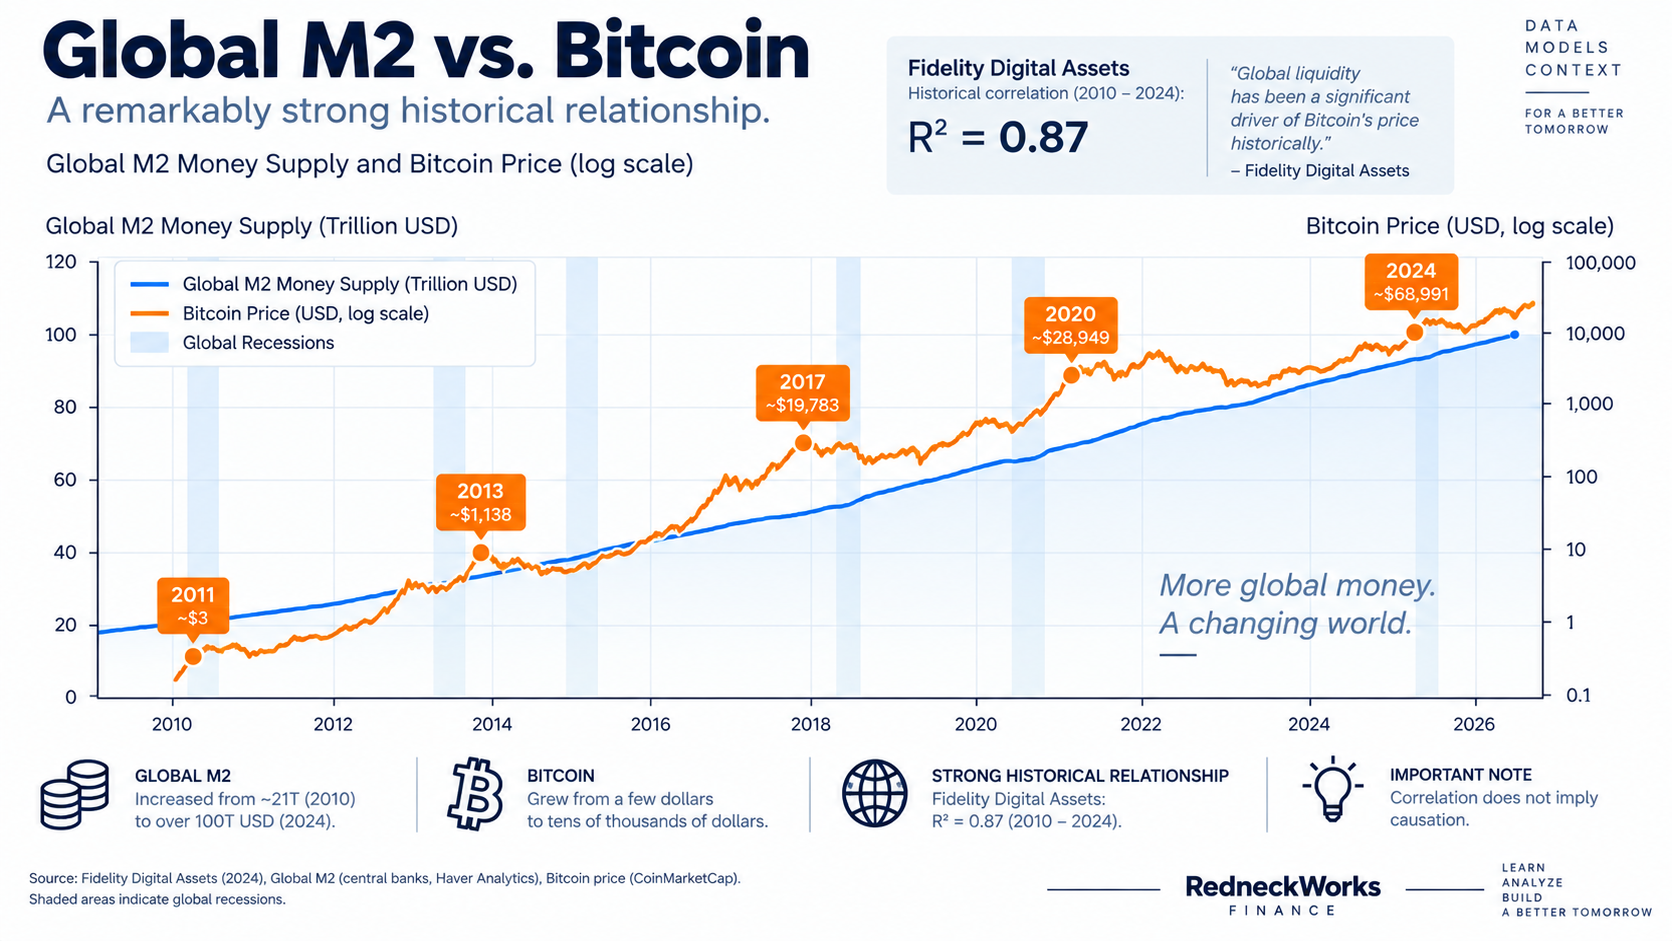
CHART 4 – Global M2 vs. Bitcoin: Two time series from around 2010/2011 onward, with Bitcoin on a logarithmic price axis. Add: Fidelity Digital Assets – historical R² = 0.87. Note: Correlation does not imply causation.
There is no simple mechanism in which more money automatically means a higher Bitcoin price. But there are good reasons to view global liquidity as one possible long-term influence on Bitcoin.
Conclusion
Since the end of the Bretton Woods system in the early 1970s, the U.S. dollar has no longer operated under fixed gold convertibility.
The modern fiat system allows a flexible money supply. At the same time, both the money supply and government debt have grown substantially over the long run.
Bitcoin introduces a fundamentally different property:
Its supply is limited.
Fidelity Digital Assets has also identified a strong historical relationship between changes in global M2 and Bitcoin.
That does not mean M2 predicts the Bitcoin price.
It does mean that global liquidity is an important factor when viewing Bitcoin in a macroeconomic context.
This adds another perspective to our existing Bitcoin models:
Power Law → long-term price development
River Model → Bitcoin in a portfolio
Global M2 → Bitcoin and global liquidity
None of these perspectives provides a guaranteed forecast on its own. Together, however, they help us examine Bitcoin from different angles.
Data → Models → Context.
This report is for informational and educational purposes only. It does not constitute investment advice or a Bitcoin price forecast.
Sources and Further Reading
Federal Reserve Bank of St. Louis (FRED)
M2 Money Stock (M2SL), seasonally adjusted monthly data.
U.S. Department of the Treasury – Fiscal Data
Debt to the Penny – historical and current data on U.S. gross federal debt.
U.S. Treasury – Debt to the Penny
Fidelity Digital Assets Research
Getting Off Zero: Evaluating Bitcoin in 2026. Research on the historical relationship between Global M2 and Bitcoin.
Fidelity Digital Assets – Getting Off Zero
Federal Reserve History
Historical background on the suspension of U.S. dollar convertibility into gold in August 1971 and the transition away from the Bretton Woods monetary system.
Federal Reserve History – Gold Convertibility Ends
Note on Global M2
“Global M2” is not a single officially published global monetary aggregate. It is a composite measure constructed by aggregating money-supply data from multiple economies. Results may differ depending on the underlying data sources, exchange-rate conversions, country coverage, and methodology.
Data reference date: September 2026.