
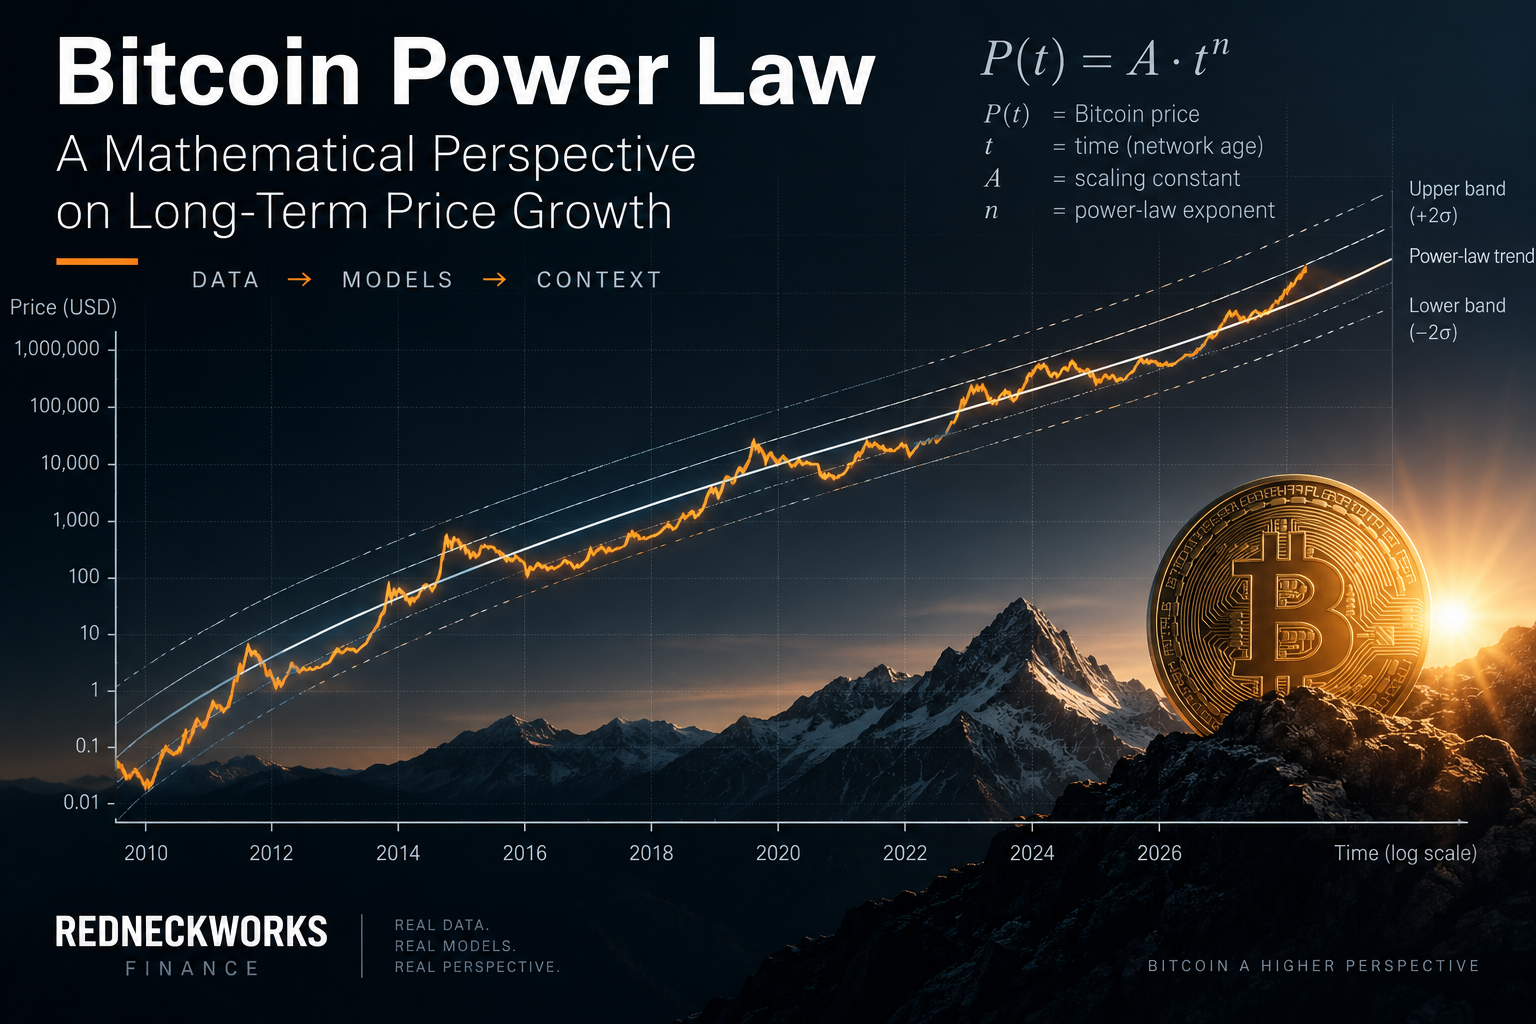
Bitcoin Power Law: A Mathematical Perspective on Long-Term Price Growth
The Bitcoin Power Law model describes Bitcoin's long-term price development as a mathematical relationship between the age of the network and its price. This report explains the model, its assumptions, what it can tell us, and where its limitations begin.
Bitcoin Power Law: A Mathematical Perspective on Long-Term Price Development
Bitcoin is one of the most volatile major financial assets. Within just a few months, price movements of several dozen percent can occur. At the same time, Bitcoin's long-term development since its early trading years reveals an interesting pattern.
The Bitcoin Power Law model attempts to describe this pattern mathematically.
Unlike traditional price forecasts, the model does not try to answer the question:
“Where will Bitcoin be next week?”
Instead, it examines a much longer-term question:
“Is there a mathematical relationship between the age of the Bitcoin network and its long-term price development?”
The Basic Idea
A power law has the general form:
where:
P(t) represents the modeled Bitcoin price,
t represents time, or the age of the Bitcoin network,
A is a scaling factor,
n is the power-law exponent.
For Bitcoin, time is typically defined as the number of days since the Genesis Block on January 3, 2009.
The key property of this function becomes visible when both axes are transformed logarithmically.
Starting with:
taking logarithms gives:
This transforms the curved power-law function into a straight line in log-log space.
The slope of that line corresponds to the exponent n.
Why Is the Log-Log Representation Interesting?
On a conventional Bitcoin price chart, the enormous price increases of more recent years dominate the visualization. As a result, the early years are barely visible.
A logarithmic representation reduces this problem.
When both time and price are plotted on logarithmic scales, Bitcoin's historical price development exhibits a remarkably linear structure over long periods.
This is the foundation of the Power Law model.
A reproduction published in 2026 using 5,674 daily closing prices from 2010 through early 2026, for example, estimated an exponent of approximately 5.69 and an R² of around 0.96 for the regression in log-log space.
However, this does not mean that “96 percent of Bitcoin's price is explained by time.” The R² applies to the logarithmically transformed data within the analyzed sample.
What Does the Exponent Mean?
In simplified form, the relationship is approximately:
This is fundamentally different from constant exponential growth.
With exponential growth, for example, a constant relative growth rate could be assumed.
Under a power law, however, the relative growth rate depends on the age of the system.
For:
the derivative is:
The relative growth rate is therefore:
This means that the model's relative growth rate decreases as Bitcoin gets older.
That has an important consequence:
The Power Law model implies declining percentage growth rates over the long term.
According to the model, Bitcoin could therefore continue to increase in price over the long term while its percentage growth rates become progressively smaller compared with its early years.
From a Trend Line to a Power-Law Corridor
The actual Bitcoin price does not, of course, remain exactly on the mathematical trend line.
Historically, Bitcoin has traded significantly above or below that line at various times.
For this reason, Power Law charts are often expanded into a corridor.
The center line represents the long-term trend, while additional lines or statistical bands indicate possible deviations from that trend.
One possible interpretation is:
below trend → trend region → above trend
However, these regions should not automatically be interpreted as “undervalued” or “overvalued.”
They initially show only how far the current price deviates from the mathematical model.
What Makes the Model Particularly Interesting?
The Power Law does not attempt to predict individual market cycles precisely.
Halvings, ETF inflows, liquidity, monetary policy, regulation, institutional demand, and short-term market sentiment are not direct inputs into the simple equation.
At its core, the model reduces long-term price development essentially to:
At first glance, this appears extremely simplistic.
Yet that simplicity is precisely what makes the model interesting.
Despite major changes in the Bitcoin market—including exchange crashes, regulatory changes, halvings, and very different macroeconomic environments—its long-term price development can historically be approximated surprisingly well by a relatively simple power function.
Giovanni Santostasi and the Network Hypothesis
The model is particularly associated with physicist Giovanni Santostasi.
The basic idea of a time-based Bitcoin Power Law relationship was discussed many years ago and was subsequently developed further.
A broader interpretation attempts to connect Bitcoin's price development with the growth of the Bitcoin network.
In simplified form, the hypothesis is:
where represents the size or adoption of the network.
If an additional relationship similar to a Metcalfe-style network effect is assumed:
then:
Santostasi and Stephen Perrenod report a price exponent of approximately 5.69 in their research and attempt to explain it through network adoption and network effects.
Scientifically, however, this is a much stronger claim than simply observing that historical Bitcoin prices fit a power-law curve reasonably well.
Correlation Is Not a Law of Nature
This is one of the model's most important limitations.
A straight line on a log-log chart does not automatically prove that Bitcoin follows a fundamental law of nature.
At least two separate questions need to be considered:
1. Does a power-law function describe the historical data well?
There is noteworthy empirical evidence that it does.
2. Is there actually a stable economic or network-based mechanism that generates exactly this power law?
That question is much more controversial.
More recent research highlights precisely this distinction. A 2026 study by Baquero and Menezes questions the structural interpretation while reaching an interesting result at the same time:
In their walk-forward tests, the simple Power Law model outperformed several traditional time-series models at longer forecast horizons of 12 to 24 months.
This leads to an interesting conclusion:
The model may be useful as a long-term statistical model without implying that Bitcoin follows an immutable mathematical law.
What the Power Law Cannot Do
The model cannot reliably determine:
when the next Bitcoin bull market will begin,
when a market cycle will reach its peak,
where Bitcoin will trade next week,
how Federal Reserve policy will affect the price,
how strongly ETF inflows will influence the market,
how the market will react to regulatory decisions.
Even within the long-term trend, very large deviations can occur.
Historically, the residuals of a regression discussed in 2026 were approximately 0.30 logarithmic decades. Roughly speaking, this corresponds to a possible factor of about two around the central model line.
For short-term trading, that level of uncertainty is far too large.
The Power Law Is Not a Price Target
A common mistake is to interpret the Power Law trend line as an exact future price target.
That would be an overinterpretation of the model.
If the model produces a certain trend value for a future date, it does not mean:
“Bitcoin will reach this price on that date.”
Instead, the statement is:
“Assuming the historically observed Power Law relationship continues to hold, this is the mathematically extrapolated long-term trend at that point in time.”
That distinction is critical.
How We Use the Model at RedneckWorks
At RedneckWorks Finance, we therefore do not consider the Bitcoin Power Law in isolation.
It is one component among several.
The model becomes particularly useful when combined with:
the current Bitcoin price,
distance from the Power Law trend line,
historical Power Law bands,
on-chain data,
Fear & Greed indicators,
prediction markets,
macroeconomic data,
liquidity and interest-rate developments.
This does not create an automatic trading signal.
Instead, it provides context.
The Power Law addresses a different question from short-term market indicators:
“Where is Bitcoin relative to its long-term mathematical growth curve?”
Conclusion
The Bitcoin Power Law model is one of the most interesting mathematical approaches to describing Bitcoin's long-term price development.
Its strength does not lie in predicting Bitcoin's price tomorrow or next week.
Its strength lies in perspective.
Over an unusually long period, Bitcoin's historical development can be described by a relatively simple relationship between price and time:
At the same time, the model points to an important long-term effect:
declining relative growth rates as the Bitcoin network gets older.
There is no guarantee that this relationship will continue to hold in the future.
For that reason, the Power Law should be viewed neither as a law of nature nor as a promise about future prices.
It is a mathematical model.
And that is precisely where its value lies:
Data → Models → Context
Nothing more—but nothing less.